

It’s that time of year again. Cooler weather is upon us. Colorful lights are starting to pop up on rooftops. The kids are excited as they count down the remaining days of their fall semester. You guessed it. It’s market forecasting season.
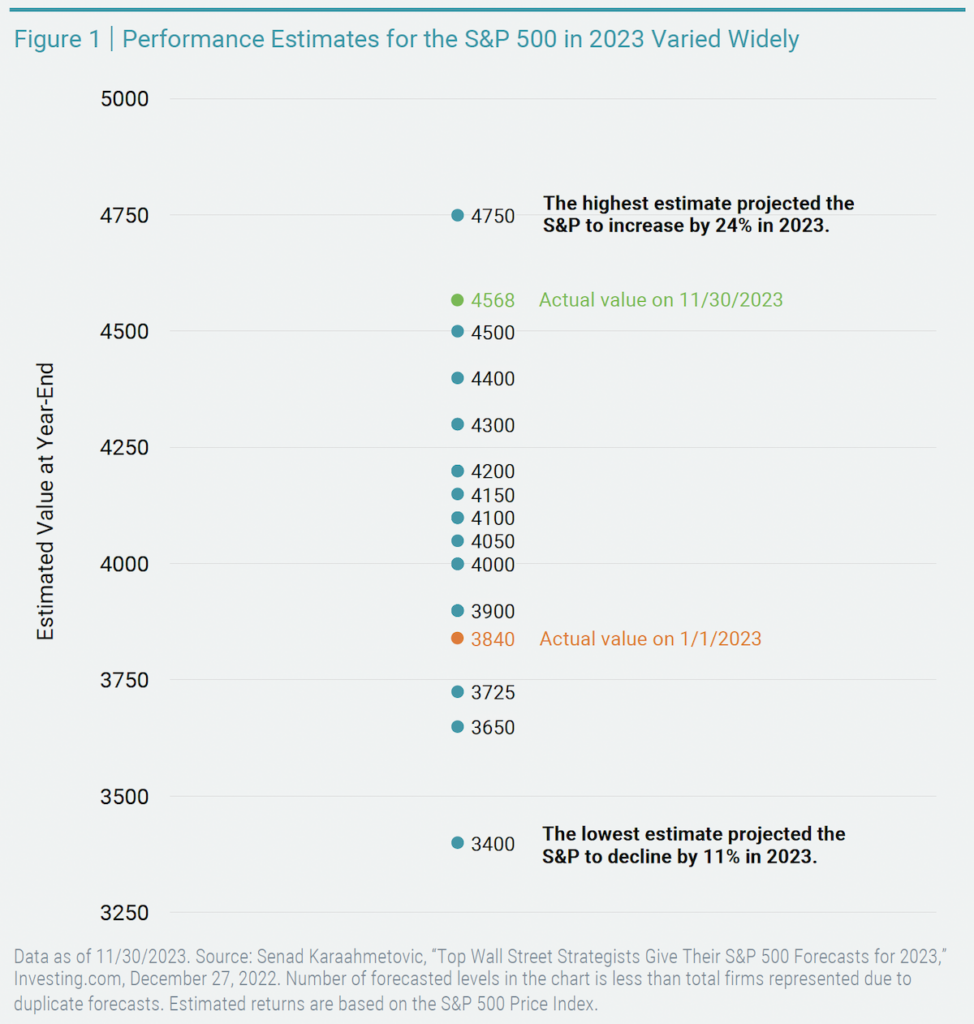 Every year around this time, we begin to see “expert” forecasts on where the market will go next year. Many investors rely on these predictions to inform their portfolio positioning. The problem? No one is very good at consistently getting these forecasts right. We looked back at past estimates from industry strategists to offer some perspective. First, there tends to be a wide range of projected outcomes across strategists. Figure 1 provides an example that plots 23 firms’ estimates of the S&P 500® Index level at the end of 2023.
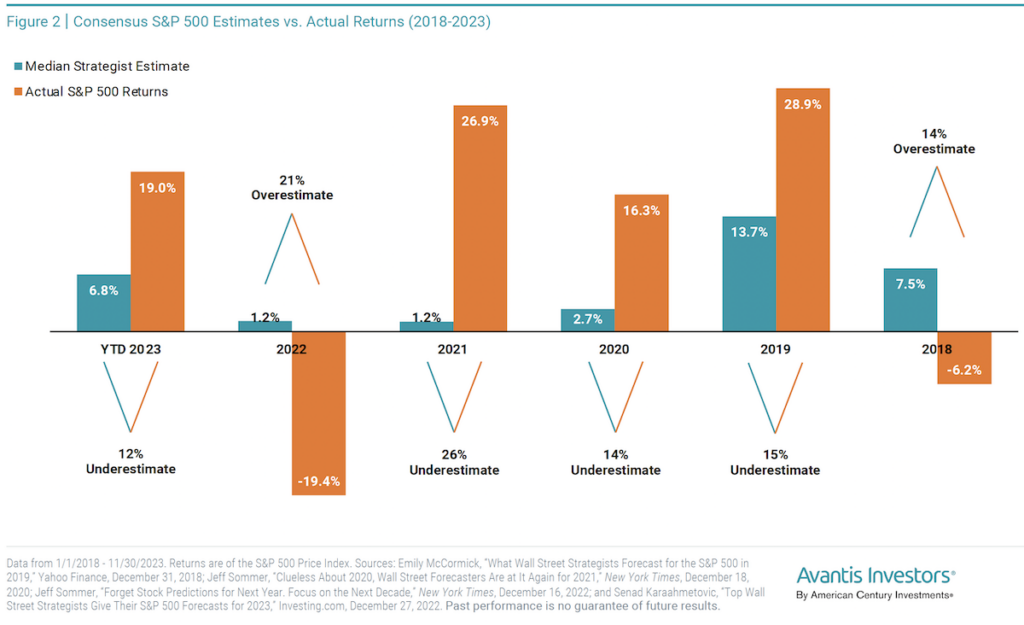
In Figure 2, we show median, or consensus, estimates from compiled industry strategist forecasts versus actual S&P 500 returns for year-to-date 2023 and the preceding five years. The results fall short of inspiring awe. For the five completed years, the estimation error ranged from 26% too low to 21% too high. On average, the median annual estimate was off by about 18 percentage points — nearly double the index’s long-term average annual return!
Academic research offers more insight into the difficulties of predicting the annual equity premium. In 2008, finance professors Ivo Welch and Amit Goyal published a study on the performance of predictive equity premium models.
They explored 17 variables previously published in papers as good predictors of the equity premium. They found that when examined out of the sample, most models failed to deliver statistically significant outperformance versus the long-term average equity return in predicting future equity premiums.
Many underperformed the long-term average entirely. In 2021, they updated their work, including 29 additional variables, with no change to the key takeaway of their original findings.1 The implications for predicting next year’s S&P 500 return are clear but also offer a note of caution for the long-term capital market assumptions (e.g., 10- or 20-year estimates) that strategists often put out. It’s worth pointing out that there’s wide variation in those estimates when comparing them across firms, so investors should bear in mind that using them could yield meaningfully different results.2
But what does it mean to use long-term averages as our base expectation for the future? What we know is that stocks have positive expected returns, which are higher than what we should expect to achieve with bonds. But we also must recognize that they have higher variability over time. The long-term average returns and volatility (standard deviation) for stocks and various bond categories are presented in Figure 3.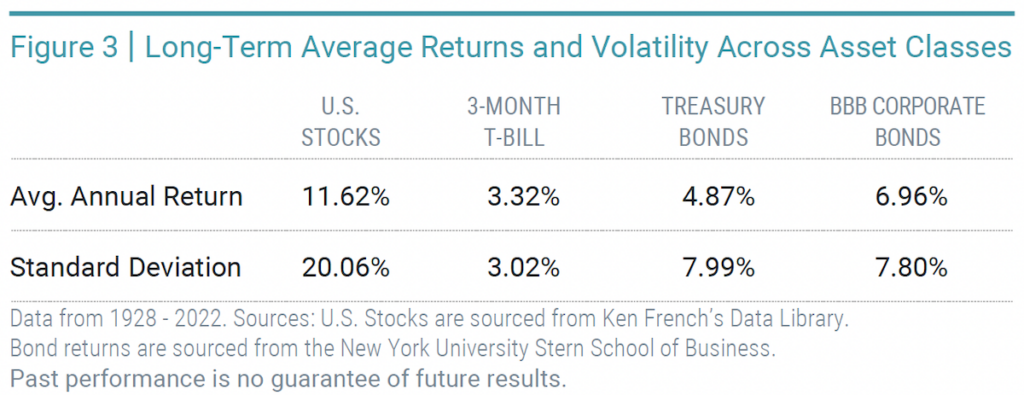
To put it in perspective, consider this analogy for the probability of stock returns. Imagine a non-translucent bag with 12 green balls and 8 red balls. Despite having a higher likelihood of picking a green ball than a red one, there is plenty of uncertainty about any individual draw. While the odds are higher of having 2, 3, 4 (or more) consecutive green draws, we can be unlucky and get 2, 3, 4 (or more) consecutive red draws. But that doesn’t change the odds in favor of green for the next draw. We know that if we look at a collection of many draws, greens will win about 60% of the time.
Figure 4 digs deeper into historical U.S. stock returns. Relating to our green and red ball analogy, holding stocks for longer periods has historically resulted in a greater chance of realizing a positive return (shown in the bar chart). 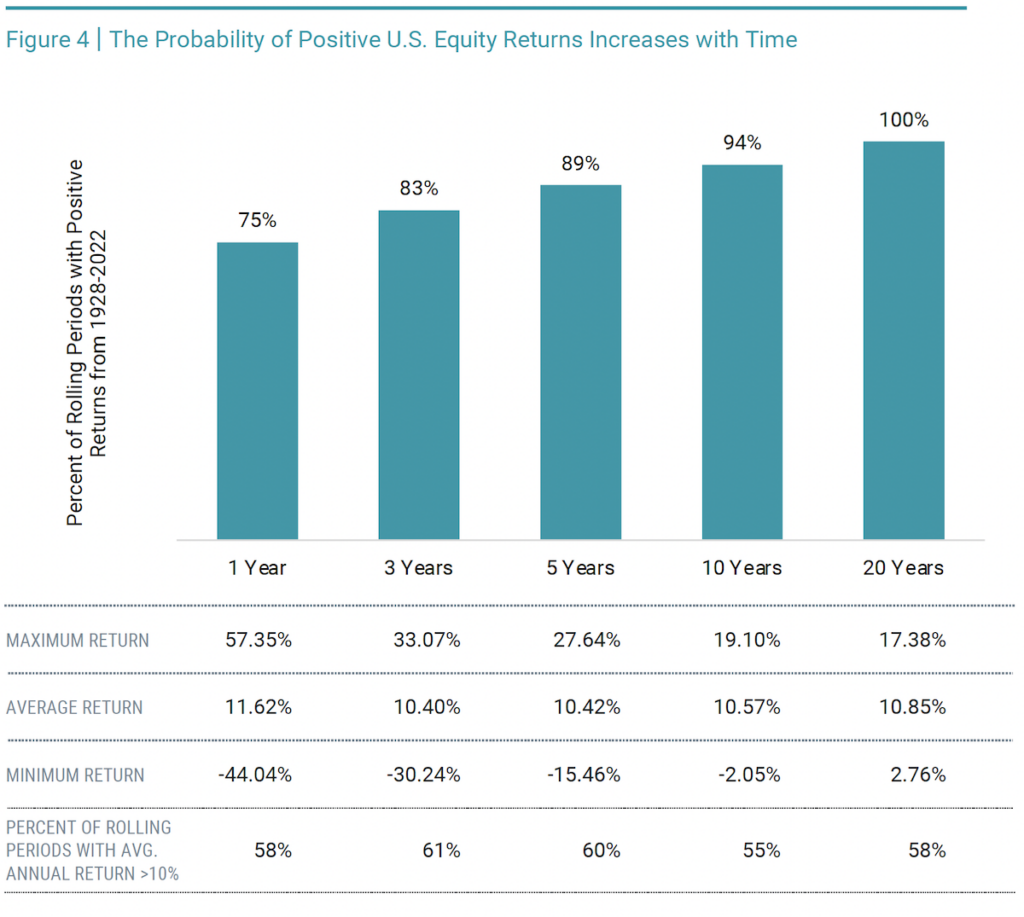
The table also shows the percentage of periods that have resulted in returns (annualized for periods greater than one year) that have exceeded 10% — a common heuristic for the average annual return for stocks. The outcome is about 60% regardless of the time horizon, but importantly, the range of outcomes narrows with longer periods, as shown in the max and min return observations.
Predicting intentionally (i.e., due to overconfidence) or unintentionally (i.e., due to fear) what will happen the next day, week, month, or year with the stock market steers us from looking at our investment journey as a whole. Making market calls based on short-term predictions with no predictive power can potentially leave us worse off versus focusing on expectations based on the rich history of empirical data.
The research from Welch and Goyal highlights this point.
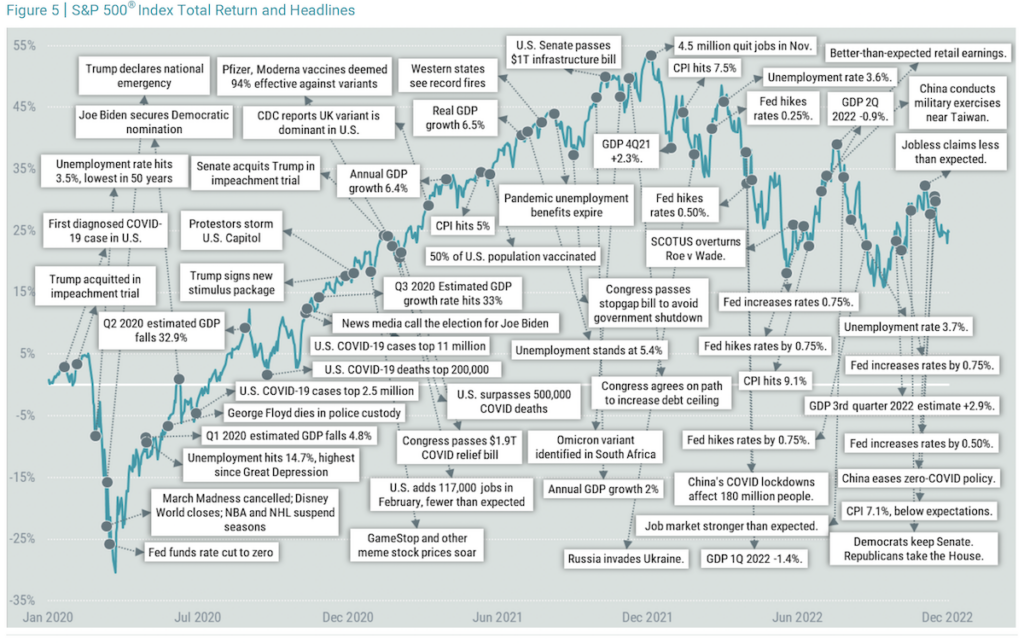
Remember, previously unexpected news and uncertainty will push markets up and down, as shown in Figure 5 for the last three years of the S&P 500 alongside notable headlines. Recognizing that this is a reality of investing but focusing on the big picture can help us avoid the temptation and pitfalls of trying to forecast markets.
Endnotes
-
-
Ivo Welch and Amit Goyal, “A Comprehensive Look at the Empirical Performance of Equity Premium Prediction,” Review of Financial Studies 21, no. 4 (July 2008): 1455-1508; Amit Goyal, Ivo Welch, and Athanasse Zafirov, “A Comprehensive 2022 Look at the Empirical Performance of Equity Premium Prediction,” Swiss Finance Institute Research Paper No. 21-85 (September 2021).
-
Horizon Actuarial Services, “Survey of Capital Market Assumptions 2023 Edition,” August 2023.
-
Download a PDF of this article
Download the November 2023 Market Review
This article was provided by Avantis Investors and we have been given permission to share this information with our clients and potential clients.