
Valuations of publicly traded companies are a frequent topic of conversation among investors and for good reason. Valuation ratios tell us the price of stocks relative to fundamentals like earnings, sales, and book value. In other words, valuation ratios are an excellent way to understand the long-term attractiveness of groups of stocks relative to:
a) one another
b) their historical norms.
A large body of academic evidence ties valuation levels and long-term expected returns, and intuitively, that the price we pay for a stream of expected cash flows is linked to our expected return is simple algebra. Holding all else constant, if there were two different prices for the same stream of future cash flows, the one with the lower price would have the higher expected return.
So, when a group of stocks is more attractive, that is often a sign of higher expected returns in the future versus when they are more expensive. However, we know that the relation between valuations and performance is noisy, particularly over short horizons.
With that framework in mind, let’s look at how two subsets of the U.S. stock market compare in 2023 on a common valuation ratio — price-to-earnings (P/E). In Figure 1, we present where well-known U.S. large-cap and small-cap value indexes stand today versus where they stood at the start of the year and put it all in the context of their historical averages, highs, and lows (since 2000).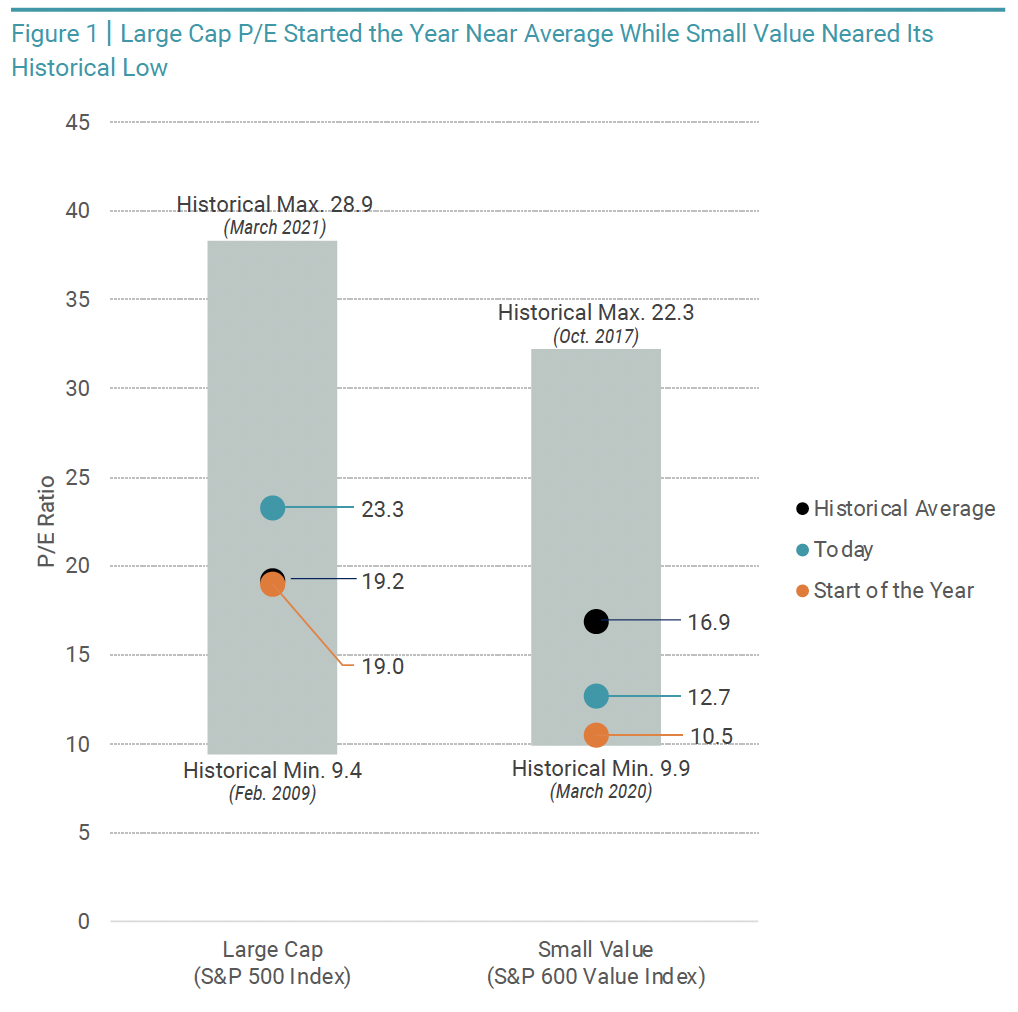
We observe that the P/E on large-cap stocks was much higher than small-cap value stocks to start the year (19.0 vs. 10.5). This alone is unsurprising. We would generally expect a selection of value stocks, typically by definition those with low prices relative to fundamentals, to have lower valuation ratios than all large-caps. We see this in the historical averages of 19.2 for large-cap stocks and 16.9 for small-cap value stocks.
More interesting is where each index stood relative to its history at the start of the year. Large-cap stocks were right around their long-term average (19.0 vs. 19.2), while small-value stocks were well below their average (10.5 vs. 16.9) — nearly 40% lower! A P/E of 10.5 is very close to the lowest point observed since 2000 — 9.9 in March 2020.
The result was a wider than average “valuation spread” — or difference between valuations of large-cap and small-value stocks to start the year. Today, the spread is even more significant (a difference of 8.5 before vs. 10.6 today) as we’ve seen the P/E on large-cap stocks increase more this year than for small-value stocks.
This is partly due to large-caps having outperformed small-value stocks in 2023 despite large-caps appearing much more expensive at the start of the year, a reminder of the noisiness of these relationships over shorter horizons. The P/E now for large-cap stocks is 21% higher than average, while small-value stocks are still 25% below average.
This all begs the question — should we be surprised by what has transpired this year? A look at how stocks have performed over time after we observe different valuation ratios can provide perspective. In Panel A of Figure 2, we take these same large-cap and small-value indexes and plot monthly P/E ratios since January 2000 against subsequent one-year returns.
The dotted lines plot the linear relation based on each index’s sample observations (or data points). The slope of each line is negative. This tells us that there’s an observed inverse relation over the sample period whereby one-year subsequent returns tended to be higher on average after lower valuations, and returns tended to be lower after valuations were higher.
However, we also find that the observations for both indexes are widely dispersed around the dotted lines, with quite a lot of noise in the results. For example, after high P/E ratios, we sometimes see relatively low or negative returns to follow, but also some very high return observations (particularly in large caps). This is reflected in low R-squared results, which means valuations explain little of the observed variation in these subsequent one-year returns over time.
Panel B of Figure 2 presents a longer-term perspective with monthly P/E ratios against subsequent five-year returns. Versus the one-year results, the similarities and differences are clear. We still see negative slopes on the linear relation plot lines, so the expected relation remains. However, the return observations fit tighter to each line. Fewer observations stray far from the trend line than in the one-year plots. Lower current valuations are associated with higher subsequent returns over five-year periods, while higher valuations are associated with lower subsequent returns.
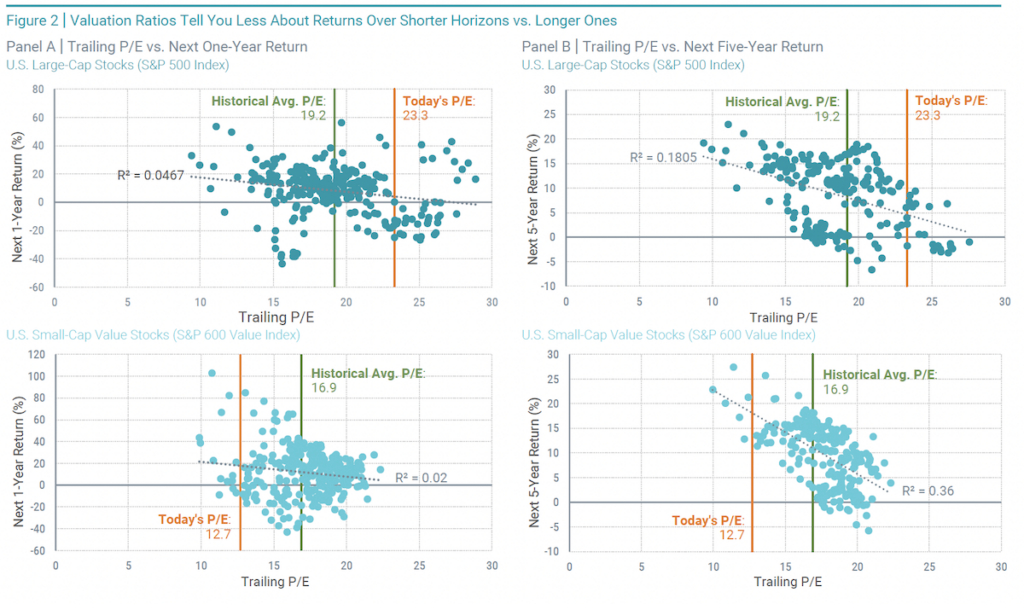
The R-squared values also increase considerably with five-year returns, again telling us that valuation ratios offer more information about differences in returns as we extend the time horizon. Intuitively, this makes sense.
Valuations contain information about future expected returns, but realized returns have expected and unexpected components. As you look at longer horizons, the expected component will play a bigger role. Five years is a long time, but when we think about saving for retirement, the time periods at play are even longer.
The data in these charts serves as a great reminder to investors that the lens through which we view results matters. If we make plans for the long term and obsess over the short term, we’re unlikely ever to be satisfied or feel good about our decisions.
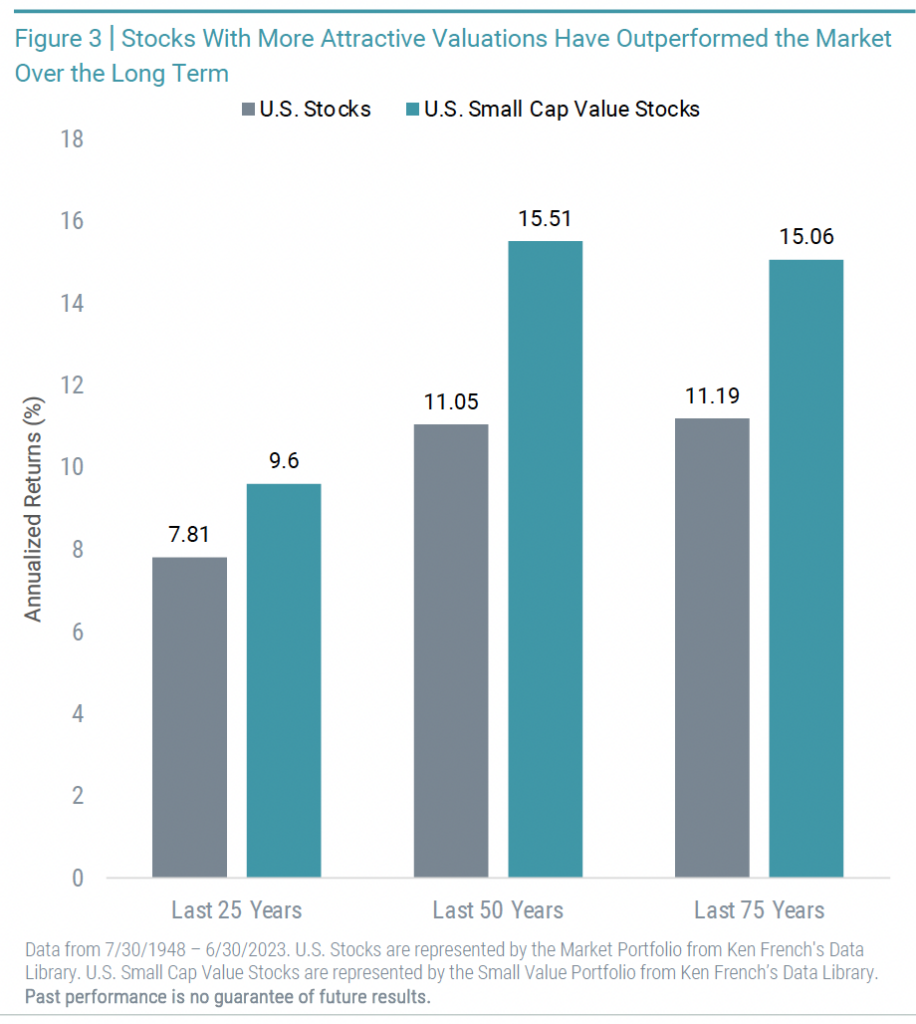 Certain groups of stocks (i.e., value stocks) tend to have more attractive valuations than more expensive stocks, and their long-term average returns are higher (Figure 3). Chasing the stocks that have performed best over a recent, short-term period may also mean chasing those with valuations that have been running up — the stocks with expected returns that may not be as good. Long-term discipline matters.
If we set a long-term asset allocation appropriate for our goals, we should expect to do well as investors over the long term. But doing well over the long term means being comfortable with the noise of the short term, including when realized returns look pretty different from expected returns.
Download a PDF of this article
Download the August 2023 Market Review
This article was provided by Avantis Investors and we have been given permission to share this information with our clients and potential clients.