

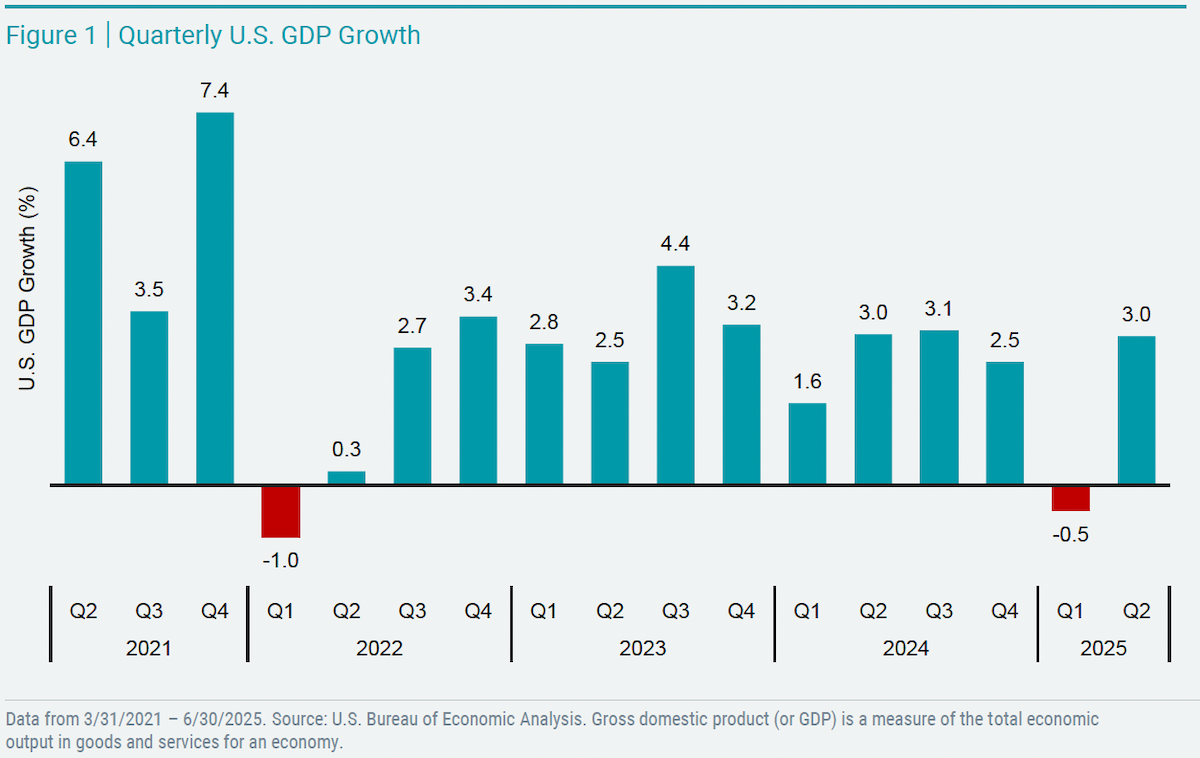
U.S. gross domestic product (GDP) — a key economic measure capturing the total value of goods and services produced — was recently announced at an estimated growth rate of 3.0% for the second quarter. This follows a -0.5% decline in the prior quarter, which was the first time quarterly U.S. GDP shrank in three years.
The bounce back to positive growth in the second quarter places the latest GDP result back in similar territory to growth rates seen throughout 2023 and 2024. See Figure 1.
However, public discourse on the GDP numbers in 2025 has seemed to focus nearly as much on the underlying components driving overall GDP as the headline numbers themselves. We explain why, diving into the details of how GDP is calculated and how changes beneath the surface have influenced growth in 2025.
How Is GDP Calculated?
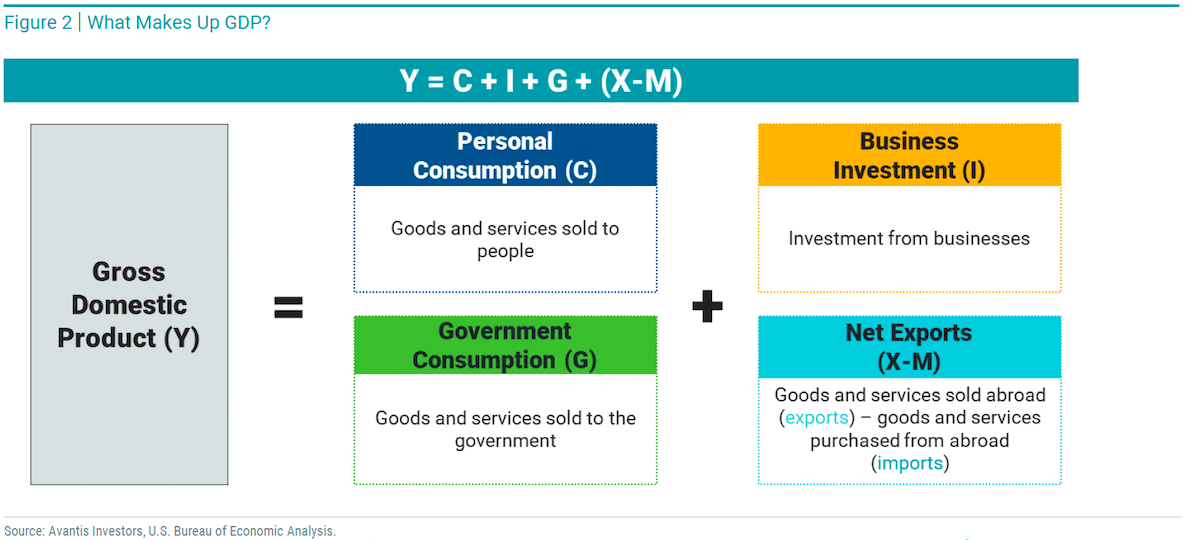
As shown in Figure 2, under the expenditures approach — the most popular and widely cited method for calculating GDP — four “demand categories” combine to capture total spending on goods and services: personal consumption, business investment, government consumption, and net exports.
For a practical explanation, we use the second-quarter U.S. GDP as a case study, setting aside growth rates for a moment. In Figure 3, we show total GDP in trillions of U.S. dollars (annualized and seasonally adjusted) along with amounts for each underlying category. Over the period, total U.S. GDP was $30.3T.

This figure combines $20.6T in personal consumption of goods and services like cars, food and health care; $5.4T in business investments like equipment and inventory; $5.2T in government spending on things like defense and infrastructure; and $3.2T in exports sold to other countries less $4.1T in imports brought into the U.S from overseas.
A few things stand out in the data, and a few things often misunderstood also warrant attention. Personal consumption is by far the largest component of U.S. GDP and critical to growth (consider that declining consumer spending can also negatively affect other demand categories like business investment).
This is true of most major developed economies. China is a notable exception where business investment currently plays a larger role.
While certainly not small, government consumption was only about a quarter of personal consumption. But importantly, what’s attributed to governments within GDP calculations shouldn’t be confused with all government spending. Only government purchases of goods and services are counted in GDP.
For example, interest payments on debt and transfer payments (e.g., Social Security benefits) aren’t counted because these payments aren’t tied to goods or services. However, this capital may lead to consumption reflected in other demand categories. Estimates of total U.S. government spending relative to GDP are higher today than the 17% share for the government consumption category in Q2.
And why include exports but subtract imports? Remember, GDP’s goal is to measure the value of domestic production. In other words, it only refers to what has been produced within a country.
Purchases from U.S. consumers, businesses, and government entities will appear in the relevant U.S. GDP demand category. Still, if U.S.-developed goods and services are sold abroad (i.e., exported), there must be a way to capture that, too. Who buys the product doesn’t change the fact that it was produced in the U.S. Counting exports in GDP takes care of it.
On the other hand, U.S. imports are goods and services produced outside the U.S. and consumed within the U.S. So, when goods are imported, at some point in the future, they will be consumed and captured in U.S. business investment, personal consumption, or government consumption.
As a result, the value of imports must be taken out to remove non-domestic production from the final numbers. The key is to understand that imported goods will eventually be reflected in the other GDP categories, and so backing them out in the GDP calculation ultimately means imports have a net-zero effect.
What’s Driving Growth Rates in 2025?
Now, with the formulas behind us, let’s examine how changes in GDP demand categories have impacted headline GDP growth rates this year compared to quarters past. In Figure 4, we show the contribution of each demand category to total GDP in each quarter from Q2 2021 through Q2 2025.

It’s clear that in this detailed view of GDP growth, the first two quarters of 2025 look quite a bit different than prior quarters. We can see the effects of businesses and consumers responding to shifting trade policy.
In Q1, imports grew significantly as businesses expanded inventory, buying from overseas suppliers before tariffs were expected to become effective. Consequently, business investment also rose.
While growth in business investment and imports was largely offsetting, there wasn’t enough growth in other categories to bring overall GDP growth out of the red. In effect, unusually high spending occurred on imported goods to avoid risks of potentially higher costs from tariffs, which weighed on GDP growth for the period.
In the second quarter, many businesses now held large inventories after their first-quarter investments. The data suggest this allowed them to sell products on hand to drive consumption while investing and importing less. As a result, total imports fell sharply while exports remained relatively stable, boosting U.S. GDP.
A tick up in personal consumption for the quarter helped as well. It’s worth noting that while the personal consumption growth rate was not as high as seen in 2024, there was still growth, meaning the absolute level of consumption was higher in Q2 than in prior quarters.
The net result was the growth rate moving back into positive territory, but by a path that looked unlike what we’ve seen in recent quarters.
A Final Word
GDP numbers will likely always be a popular topic of discussion among investors and the financial media. As we’ve demonstrated, the data in 2025 has provided plenty to analyze and discuss.
In times like these, it’s helpful to understand where the numbers come from and what’s driving the narratives you encounter, but we shouldn’t also lose sight of the reality that quarterly GDP reports are simply a snapshot of three months in time.
If we zoom out and consider the longer-term picture shown in Figure 5, it’s clear that the U.S. economy has grown tremendously over time.

It’s undoubtedly not been a straight line up, nor should we expect it to be in the future, but minor slowdowns or even contractions have consistently been overcome in time.
Right alongside the economy has been the U.S. stock market, which has built meaningful growth in wealth for investors who have stayed the course over time.
It seems clear that some of the policy changes and responses we’ve seen from businesses and consumers in 2025 have affected economic output in various ways. However, should this lead investors to consider dramatically shifting their portfolio allocations?
We don’t believe so. Short-term economic news doesn’t exhibit a strong link to long-term market returns, but sticking with the market over the long term has historically delivered positive outcomes for investors.
Download a PDF of this article
Download the August 2025 Market Review
This article was provided by Avantis Investors and we have been given permission to share this information with our clients and potential clients.